As you know, Quality Score (QS) is one of the parameters used to determine how much you have to bid to win an auction in the Search Network; if your QS sucks then you’re going to have to pay more than someone with a high QS. The problem is the info breakdown provided by Google was severely lacking – unit now… well sort of.
Google has just provided deeper insight into your Quality Score.
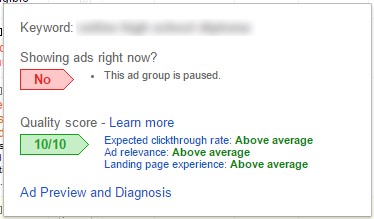
Previously if you hovered over the keyword’s little speech bubble you’d get a pop-up like this give you details on the 3 items that make up your QS:

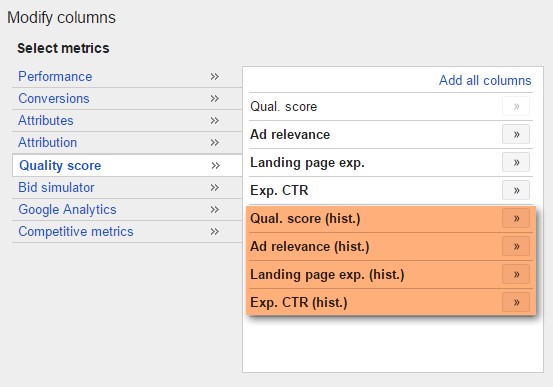
You can now access this data through your Custom columns to make reviewing the info a lot faster and this is where you see the first positive change:

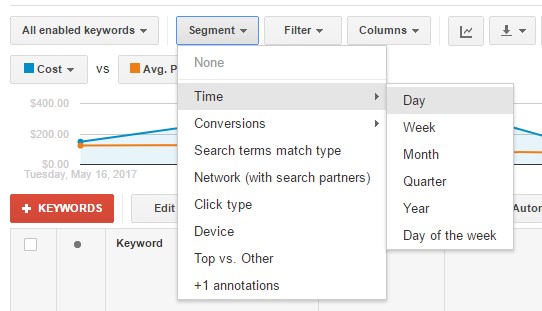
Google has also added historical data to each of the QS parameters. Awesome, but it get’s better. If you segment the data by ‘days’ then you can nail down when a drop in QS occurs and the reason for that drop.

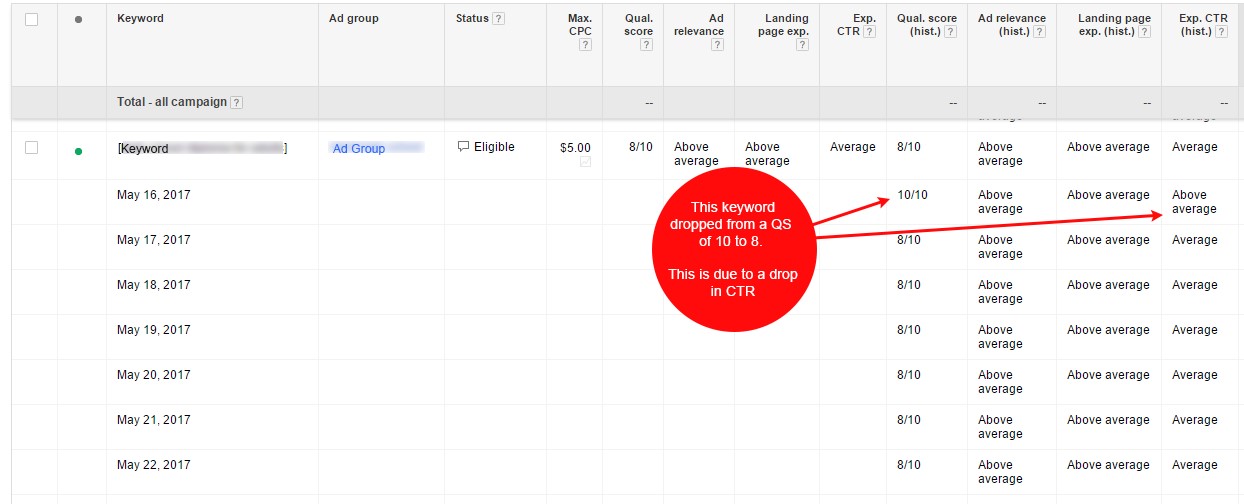
In the example keyword above you can see that the current QS is 8/10. If I segment is by the last 7 days then I can see that at the start of that period the QS was actually 10. A quick browse of the historical parameters shows that the Expected CTR actually dropped from Above Average to Average, resulting in a 2 point penalty to the QS.
You can now use this info to review any changes that occurred at this time to correlate with the drop in QS. This will come in particularly handy for changes to ads that result in a drop to ad relevance or changes to the landing page that cause a rise of fall in landing page experience.
While this new data does help provide a way to find what faults are present and when they occurred for your keyword, don’t fall into the Adwords Quality Score trap – remember that what matters is a profitable or sustainable campaign that gets real results.


Leave a Reply